


Spatial Phenomics
Spatial phenomics is the discipline of mining tissue images in their own context to identify spatial patterns that are related to clinical outcomes. It involves every step from assay development and application, scanning, image analysis and data mining.
From Assay to Data.
We are a curious, precise, rigorous, and helpful partner in spatial phenomics across the entire workflow from assays to data.


Data mining
With a complete representation of the tumor landscape including compartments, cell phenotypes and interactions, you are ready for scientific exploration: compare biomarker profiles across study groups, understand the differences between responders versus non-responders or confirm the effects of different treatment doses. Detailed information from high-plex images can inform your next steps as you move closer to developing groundbreaking treatments.
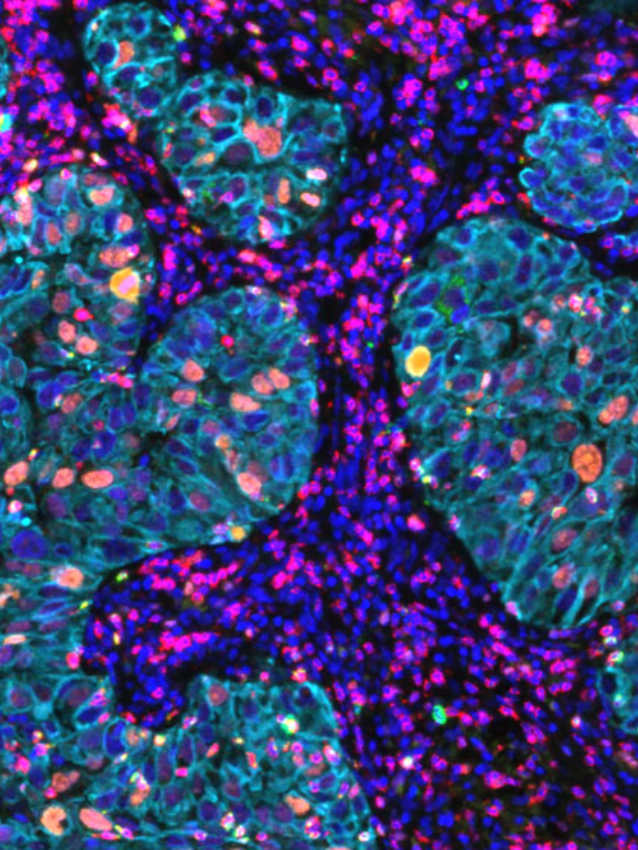
Cell interactions
Go beyond counting cells and look at cellular interactions which define the key points of immune biological processes. Measure cell clustering and dispersion, co-localization and immune-excluded regions, cellular interaction patterns and derived tissue immune response patterns localized throughout the tissue. Work together with us to mine these interactions to get insights into how active and heterogenous the immune response is in a tissue.
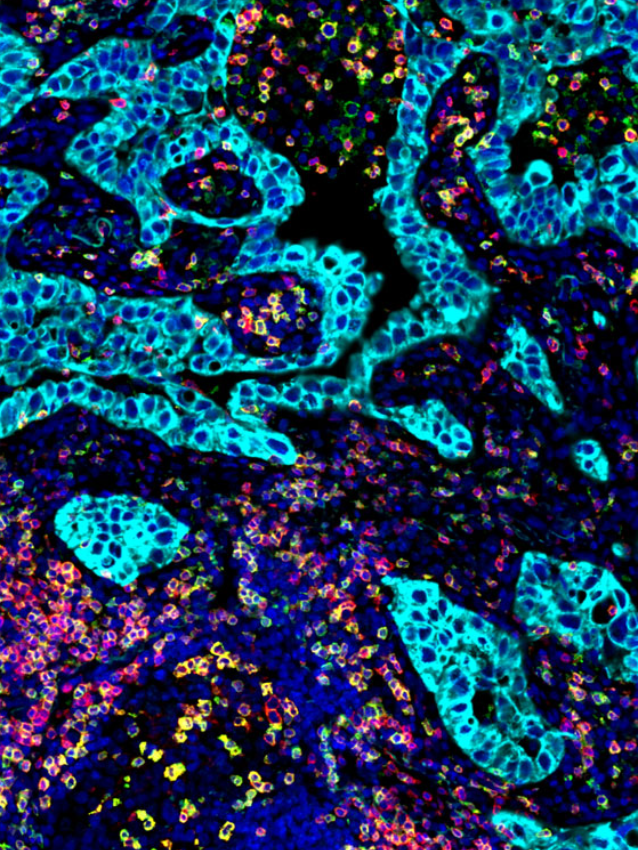
Cell quantification
Identify cell populations in the tissue and classify them into meaningful phenotypes based on the selected biomarkers. The right choice of up to 12 biomarkers supports the definition of hundreds of cell types relevant to your questions. Based on the results, improve your understanding of processes in the subject’s tissue, e.g. immune evading PD-L1 positive tumor cells, presence of suppressive, immune regulatory T-cells or different subtypes of macrophages.
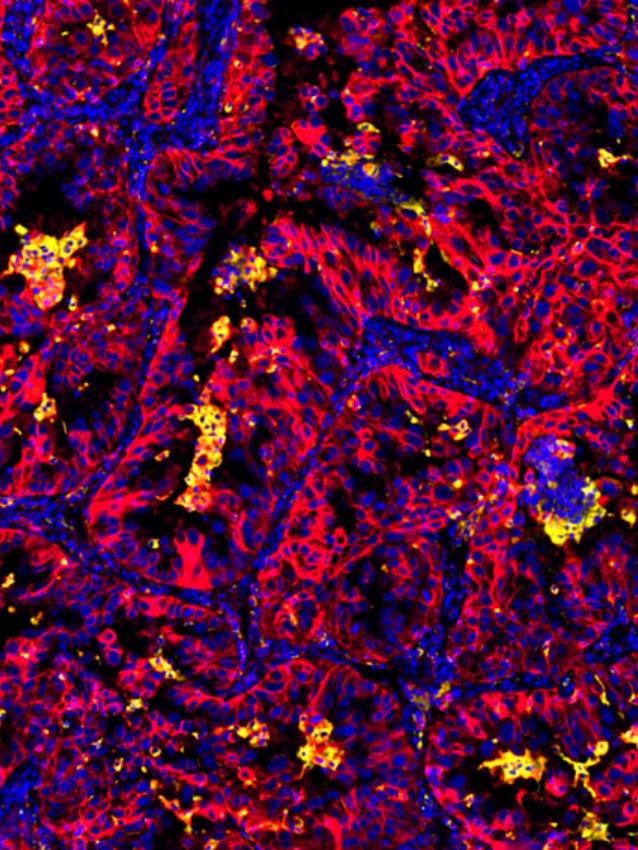
Tissue compart-mentalization
One of the most basic, yet powerful, approaches in spatial phenomics is the analysis of cell populations in different tissue compartments. Cytokeratin staining can be used to define tumor and non-tumor regions and to distinguish cell populations within those regions. With such compartment location data, you can look closer than with e.g. whole tissue -omics approaches and distinguish immune cells located in the peritumoral tissue, accumulating at or infiltrating the tumor-epithelium borders.
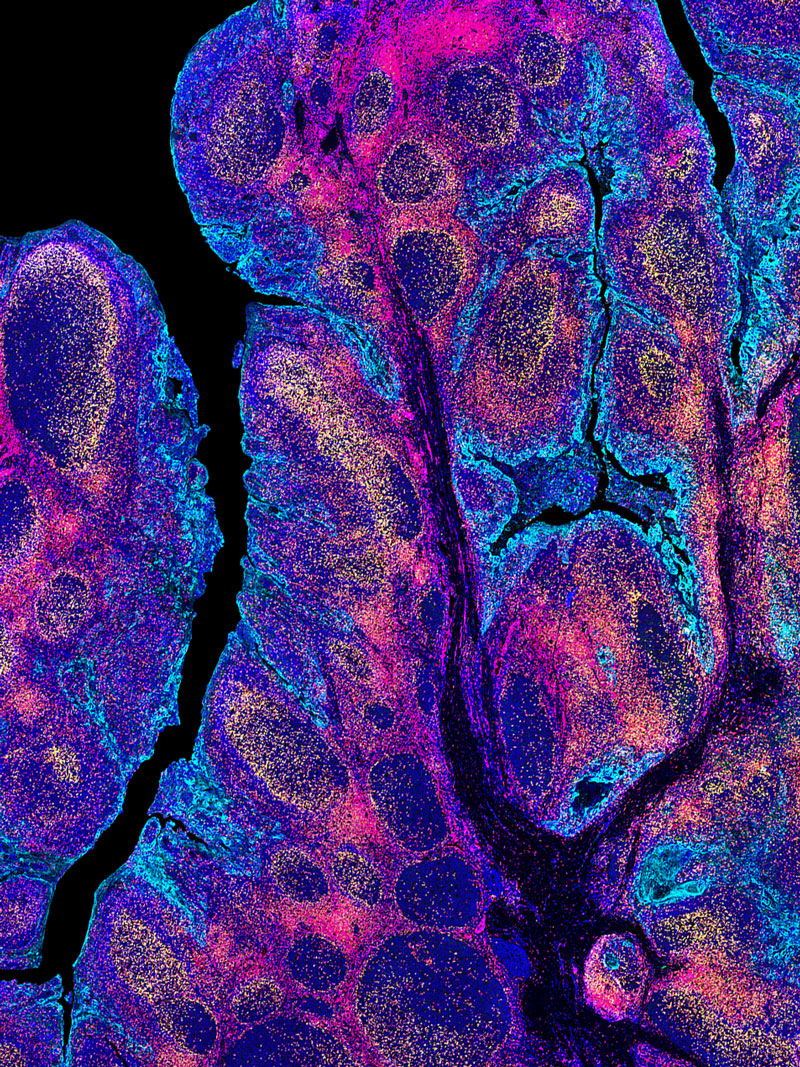
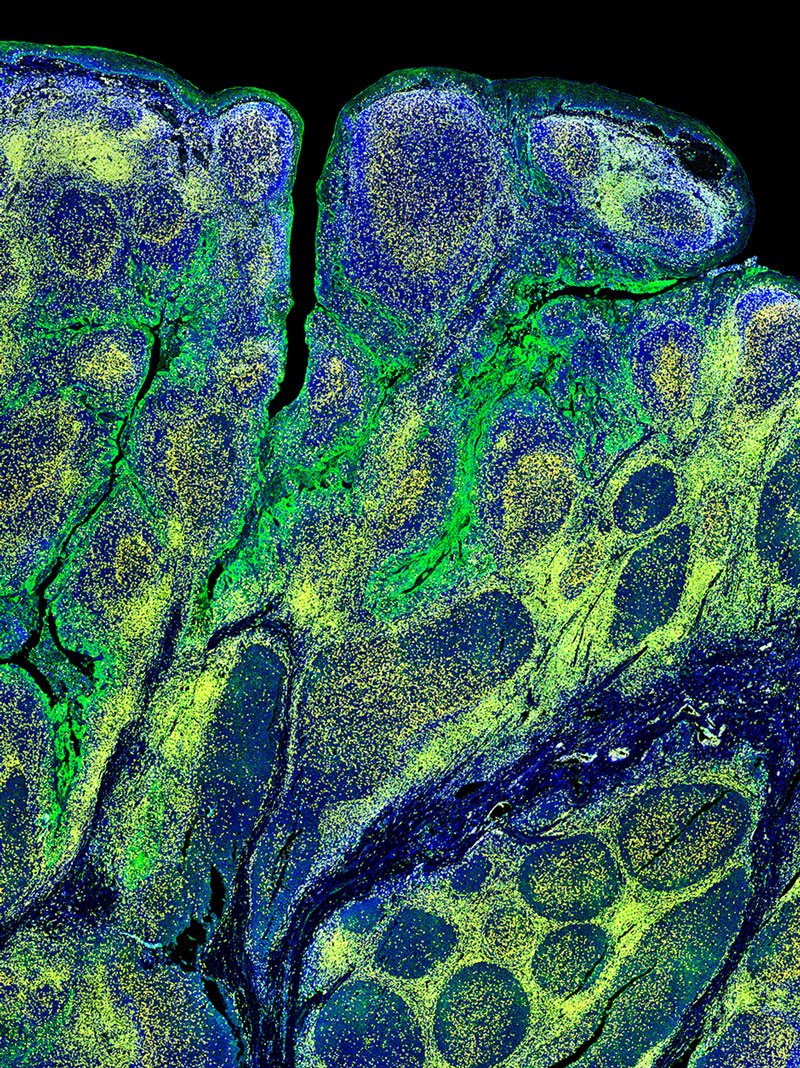
Whole slide imaging
InSituPlex™ (ISP) technology comprises multiple benefits to the spatial biology workflow. Thanks to our labeling strategy, all signals are true signals: no tedious calibration and ambiguous spectral unmixing is required. Our signal amplification technology creates a linear relationship of biomarker abundance and staining intensity with superior signal to noise ratio, ideal for image analysis. The high flexibility within our assay system enables testing of an unlimited number of biomarkers and co-localization with up to 12 markers. In addition, the gentle assay conditions allow the combination of ISP staining with subsequent staining of e.g. H&E on the same slide to bridge the worlds of traditional pathology with digital pathology.
Bridging translational research and diagnostics
With an extensive menu of markers and panels you can select between 4 – 12 markers to efficiently test and iterate on several hypotheses quickly and robustly.
High plex assays help you show feasibility and identify the most relevant biomarkers to move into the next stage of the pipeline, where you can expand the number of cases and reduce complexity to those most relevant for a larger study.
In the ideal case, the biomarkers can be even further reduced by applying the algorithms developed at the earlier stages to H&E or IHC stained samples as the project moves towards a potential diagnostic application.

Application Spotlight

You have questions.
We deliver answers.