GEN: Typically, image analysis tools are greatly influenced by inconsistent staining results and even different techniques used for multiplexing. How does the software used by OracleBio account for inter- and intra-run variability in staining quality?
Lorcan. To be honest, we do see staining variability in some sample sets, especially in complex tissues from large clinical sample sets of images. That staining variance can come in through some pre-analytical steps that can come from the tissue, assay etc. So, when we get the images for image analysis, yes, there’s a number of things that may already have happened at the pre-analytical stage that we can’t solve, but we can solve some levels of variance within the algorithms we’ve developed. We do this using AI deep learning approaches in our algorithm development.
For example, if we’re looking at something like tumor stroma segmentation with a tissue classifier and we’re using the cytokeratin layer and DAPI to train the deep learning algorithm, then if we have, say, 100 images in the study and we want to use 20 of those images to train an algorithm, we will export the actual mean intensity for the cytokeratin channel from each of the hundred images. We will look at each of the 100 images and look for those images where there is quite a high mean intensity, which means there’s more intense staining. For the images that are low intensity or have low levels of staining present, we will make sure that they’re both included in the training image set for the deep learning algorithms so that we’re exposing the algorithm to this range of variance that we may see in a sample set.
From a cell detection perspective, a very similar approach is taken where if we’re detecting e.g., CD68 cells or CD3 cells in an algorithm specifically as a top line lineage, we will look across the whole image set during the algorithm development stage. We will identify those images where the staining is weaker, or the staining is stronger based on the mean intensity across the tumor microenvironment, and we’ll make sure that those images are included. Of course, a mean intensity can tell you two things: It can tell you that generally all the cells are staining low, or it may tell you that there’s a bunch of cells there that are staining really well, but there’s just less of them, so we do need to take that into context.
In summary, I would say that by incorporating a deep learning approach into the algorithm development, we are moving away from a more standard threshold approach, where we choose a single threshold and then try and apply that to a large set of images where we may see variance. Instead, by using deep learning, we are starting to move more to an adaptive threshold approach. I think with this it does allow us to manage some of the variance that we see in these types of images. We’re moving from single chromogenic, where there was only one or two channels of interest and DAB staining, to now four, 8, 12 plex and higher where there’s multiple channels with variance in each channel. So yes, I think AI deep learning has been a big help in helping manage some of that variance.
GEN: Will we ever be able to come to a consensus on best practices for AI driven digital pathology? Or is this strictly tumor or tissue dependent?
Lorcan: Yes, I think when we talk about AI and digital pathology, it’s such a dynamic space now and there is so much ongoing development in the assays that we are seeing coming through. As I said in my presentation, this comes from all the updated scanning capabilities to the available information in the images and the strength and power of these neural networks.
But let’s not forget that the abilities of these neural networks may be very different in a couple of years’ time, so we are dealing with a very dynamic, moving landscape. With that in mind, to pin down best practices can be quite challenging. To date the algorithms developed are very much focused around answering specific questions, e.g., dealing with segmentation of tumor-stroma and identification of cells.
I think as our knowledge and use of AI develops and as we move to identifying more biological or spatial signatures from clinical sets, and that information moves more towards a diagnostic endpoint or gets closer to specific use with the patient, then I do think best practices will really come much sharper into focus. And regarding things like how do we standardize the development of these apps? I think at the moment it’s just a really dynamic area. Certainly, this is something that needs to be established to get us closer to the patient with these services and technologies.
GEN For the deep learning algorithm with additional H&E layer, is that a serial section or the same exact section used for the multiplex IF?
The images that we get from Ultivue have the RGB single channels built into the TIFF image, and they can be switched on to create the H&E images which is a real benefit not just to us, but as I said in my presentation, also to pathologists who are working on these image
Lorcan Sherry
CSO & Co-founder of OracleBio
Lorcan: Short answer, yes. It’s the same section, and from a digital pathology image analysis perspective, it is so valuable to have that H&E built into the same section. This is something that Ultivue have really taken on and tried to standardize in how they present their images for subsequent in-depth image analysis. And bear in mind, while you can certainly take serial sections and you can certainly align serial sections, you’re really not able to completely align the data. This may be okay for tissue classification purposes. But if you’re looking for specific cell identification with H&E or are trying to support algorithm development from a cell detection perspective with the H&E component of the image, it does become more challenging when you’re trying to use a serial section co-registered to a multiplex image. The images that we get from Ultivue have the RGB single channels built into the TIFF image, and they can be switched on to create the H&E images which is a real benefit not just to us, but as I said in my presentation, also to pathologists who are working on these images.
Gen: How do you analyze high plex images, say 30 to 40 markers? Do you use manual thresholding for each marker?
Lorcan: Obviously, these approaches can be quite complex with respect to high plex assays, especially going up to 30 or 40. I think, with how we use deep learning algorithms at the minute, it’s also to do with the number of channels that you can use within the neural network and that can be used to train a neural network.
A lot of neural networks are trained on traditional RGB images, which restricts them to three channels for deep learning purposes. We can certainly use AI as an approach for some of those markers around, say, accurate segmentation of cells, using nuclear markers, or T cell or macrophage lineage markers. Then we can use a manual thresholding approach for several of the other markers. You can either take all these efforts and try to build it all out into one algorithm, or the other option is that you use several different algorithms on a high plex image so that you specifically develop AI maybe for three or four markers of interest. You create data for those three or four markers, and you set up a number of algorithms that are AI based. Then you export the data for each of these algorithms and combine it to do post-processing for spatial analysis.
So, there’s different ways to do this, and it really depends on how much you want to frontload different algorithm approaches and try and incorporate an adaptive approach. Alternatively, you may want to combine AI with manual thresholds. For us as a company and what we provide as a service, we must also take into consideration overall time and turnaround time, as well as cost. Ultimately, there will be components where we will potentially combine, say, AI with manual approaches for large cohorts and high plex image analysis.
Gen: What is the limitation of using open-source software compared with licensed image analysis software? Can the data be reliable?
Lorcan: Yes, that’s a good question. I can only really speak from our perspective as a contract research organization. We have traditionally used commercially available software. We use Visiopharm and Indica Labs Halo. We have service contracts with those companies which really gives us confidence that the software is getting developed in the correct way. It’s validated by them. Any potential bugs that may arise we can turn over to their respective service teams to get those bugs fixed and get back on track quickly. So the end product is good, and ultimately we have confidence that the data coming out of the software is going to be accurate and robust, in line with our client’s expectations.
On the flip side of the coin, we are in such a dynamic area that we do know there is never going to be one software that will answer or solve all the questions. I did mention that we do some Python scripting and MATLAB capabilities in-house, and I know there are a number of open-source software that are being extensively used from a research perspective to really drive forward the understanding of spatial biology. I would say to people, yes, you absolutely can use those. Specifically, if you bring them internally, you can do some level of validation, you’re comfortable and confident that they are acting accordingly, and your data is robust, then these contributions may help move data forward and help identify spatial signatures.
Ultimately, I think it’s a question that is probably quite specific to whatever individual and their circumstances that are used. I’m not going to say you shouldn’t use open-source software by any stretch, but from a commercial perspective, it’s important for us to also have the reliability of service arms behind us that we can rely on to help us with any issues.
If you have any questions, or would like more information on some of the topics discussed during this Q&A session, please look through our scientific content available in our resource center, https://ultivue.com/resource-center
hafadmin Categories: Uncategorized Tags: digital pathology, multiplex image analysis, Points of VUE, tumor microenvironment 6490 Living in a Spatial World Q&A, Part 1GEN: If I were to design my own panel for immunofluorescence, what are the main considerations, given everything you’ve suggested during the webinar for validation?
Angela: There are several things one needs to think about when you build a new panel for multiplexed immunofluorescence. You need to consider the abundance of the targets to be able to combine that target with the right fluorescence channel. Further, the use of good quality primary antibodies is especially important, particularly to assess their performance in chromogenic DAB, which is still the gold standard for a single plex assay before moving into building a multiplexed panel.
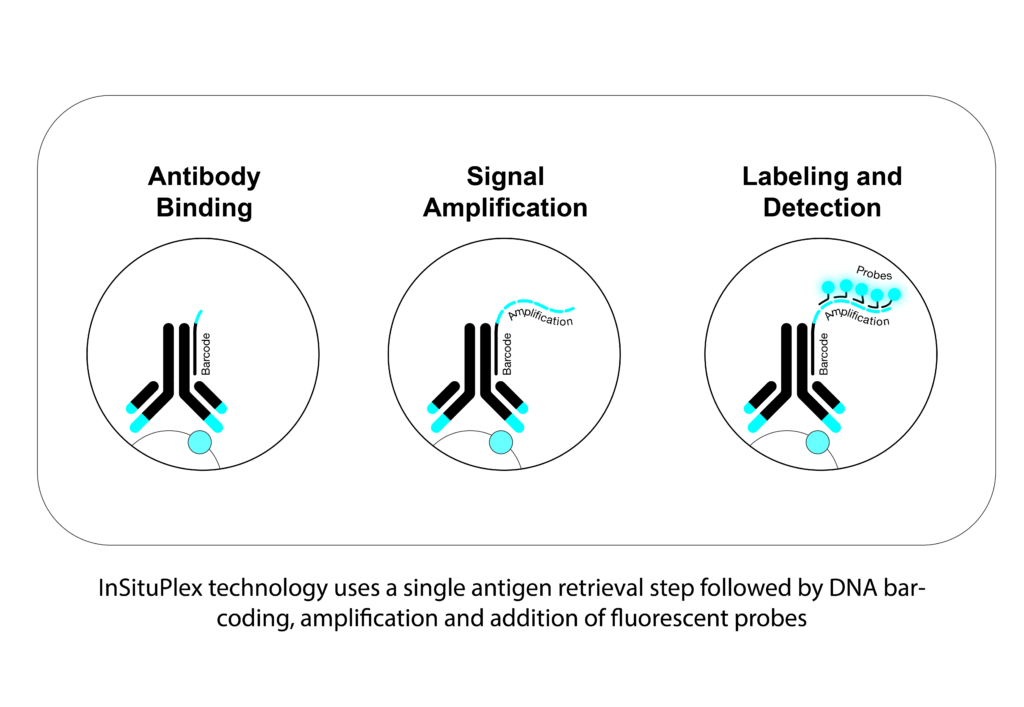
With InSituPlex® (ISP) technology you have fewer things that you need to consider as far as optimization and with that comes less variability because the workflow is pretty simple. For example, the end user won’t have issues with optimizing the concentration and optimal combination of an antibody. We don’t have a secondary antibody in the workflow, so this is also something researchers shouldn’t think about. And on top of that, because we deliberately use fluorescent channels that are spectrally distinct, you also don’t need to balance your signal. Another benefit of our technology is that we can amplify all the targets of interest at the same time, especially important for some weak signals.
GEN: Can you comment on what the best controls are for a multiplexed assay? Most companies use tonsil sample as the positive control, but is this really optimal?
Angela: Well, I would say it all depends on the type of targets you want to develop. If the target is well expressed in tonsil, that is a good starting point. At Ultivue, we always like to test the best conditions in the development of an assay, so we typically use control samples like tonsil and, where appropriate, on the actual tissue types that the study is going to be run on. Now that being said, when you are developing a target, it might not be expressed necessarily in tonsil. So ultimately what is important, is to use the appropriate tissue sample that expresses a good amount and a good level of the target of interest so that you can really identify the best conditions that would pick up low suppressors as well as high expressors of that target.
GEN: Is your H&E staining and multiplex IF used on the same slide?
What we do at Ultivue is perform multiplex IF as a first step, then we perform the H&E. This is not a virtual H&E, but instead the classically used H&E on the same exact tissue section.
Angela Vasaturo
Associate Director Scientific Affairs
Angela: The short answer is yes. Usually when we perform multiplex IF, we work on tissue paraffin embedded blocks. As far as a routine practice, once that’s performed, you’ll always have to have an additional H&E stained section from the block. With different sections, that H&E may not be truly representative of the actual tissue. In our case, it’s good practice to have the H&E from a block just to assess the quality in terms of fixation. But bear in mind, it’s critical to use the same section for the reasons that Lorcan explained for subsequent image analysis. So, what we do at Ultivue is perform multiplex IF as a first step, then we perform the H&E. This is not a virtual H&E, but instead the classically used H&E on the same exact tissue section.
GEN: Did you mention what kind of tissue preprocessing is required? Paraffin or OCT embedding?
Angela: We work with paraffin embedded samples. This doesn’t mean that the technology couldn’t be applicable to frozen samples, it’s just something that we haven’t wholly tested at this time because we focus mainly on clinical trials where paraffin embedded samples are most commonly used. With some additional steps for fixation, the technology could however be applicable to frozen (OCT) samples. But again, we haven’t tested that internally.
GEN: Angela, you mentioned there is 20% variability in the inter-, intra-day staining on the entire tissue section. While this is not a large difference maybe for known cell types, what about this variation in respect to rare unknown cell type combinations? Will this not impact further analysis downstream?
Angela: I would say that would be a little bit more difficult to evaluate on extremely rare phenotypes, and I think this is also the reason we use positive controls to evaluate the assay itself. Now, the biological variability is different than the intrinsic variability of the assay and although we are looking at the variability of the multiplex IF, we already take into consideration that 20% max of variability. There is also the component that comes from the instruments, for example, the autostainer, as well as the contribution of variance that comes from the image analysis. So, all of it is intricately linked and ultimately it is hard to really evaluate the true variability of any single component or reagent associated with multiplex IF.
Now that said, I think we have a lot to learn about those rare phenotypes. With the tools that we have for quantitative analysis, I think we are better placed today to really identify even pretty rare phenotypes by the unbiased way we look at the images. We are not pre-defining known phenotypes when you see the analysis; we really look at the single positive markers and then we combine those single positives to look at how many cells express multiples of the targets that are in the assay.
Lorcan: Yes, I agree, and I can add to that. When we talk about multiplex assays, we go from 4, 8 to 12 plex. The number of potential phenotypes that can be generated start to multiply quite substantially, and when you think about rarer phenotypes and maybe those that are not so obvious, it can be very difficult to validate and look at the variability for every single individual phenotype in something like an eight plex.
We’ve worked with Ultivue to address variance across sections that have been stained on different autostainers on different days, so what do we actually quantify? Well, we quantify every single channel for staining and how many positive cells are present for that particular marker within fields of view on sections. So, if you have an eight plex that will be 8 different readouts and that variance will be looked at, but we will also choose four or five of some of the main combined phenotypes, e.g. CD3, CD8, tumor PD-L1, and we will also count those as a phenotype manually and compare with the specific image analysis readout. All told we’ve at least got some reassurance that the variances are within the required parameters.
GEN: We have time for one last question. I think this is going to go to Angela. I’m going to combine two questions here, as I think the answers are probably short, but they’re also important. One of them, which I think is an interesting question, says the current spatial profiling is protein based, have you ever considered gene or RNA profiling based algorithms to do digital pathology? And then in connection with that, another audience member asked about limitation in terms of markers, they want to know what’s the max number of markers that can be used in multiplexing?
Angela: I think Lorcan can also help me a little bit on the digital pathology side with RNA, because he has more experience than I do. So while at Ultivue we look at proteins, there are also tools to look at RNA and actually we just presented a poster at AACR 2022 wherein we combined on the same section protein and RNA. Why would you choose one or the other if you can have both? I would be as provocative as I can be with this question.
And then the second part was the limitation in terms of number of targets, right? I think it depends on how we look at the field. At Ultivue, we currently have the maximum of 12 markers that one can choose from either our fixed off-the-shelf kits or our expansive U-VUE menu. It’s more like a choice in the sense that there are multiple companies that work in the digital and in the translational space, but also in the discovery space. When you are approaching things in a discovery way, then you need a lot of markers because this is where you need to generate your hypothesis. The more markers you can have, the better you can shape your hypothesis. Once you have done that and you need to validate your findings, you then want to reduce complexity. You wouldn’t want to go for 20-40 markers. In our experience, when you start from 12, or even eight, you have a good number of markers contributing to a very high number of phenotypes that you can identify and multiple hypotheses that you can validate at the same time.
We would suggest to researchers to initiate their studies from this higher number of targets on a small cohort of samples to identify the targets that give you the clinical utility. Then, ideally, move on only with very few or the least number of targets on a big cohort so that you can really have clinical value and validate your findings. Eventually in the future, as I mentioned during the presentation, we will want to use the data that we generate with mIF to train AI algorithms to be able to just use H&E.
Lorcan: Yes, I agree with what Angela said there. Maybe just from a digital pathology perspective, protein versus RNA, both HALO and Visiopharm software have got some great modules for the detection of the RNA and protein signals, be it sort of a spot signal or a clump of spots. These signals or stains are captured in different channels, then the signal can be co-localized and detected. Certainly with the image analysis available we are able to do that.
From a target perspective with image analysis, the number isn’t really the issue. From a practical sense though, you may need to think about when you get up to something like 100 targets, how you will develop your algorithm or how you’ll look at phenotypes in different cells. When you’ve got so many different markers, it becomes really quite challenging. Angela is right, the higher numbers of targets are usually more associated with the earlier discovery studies. There you’re doing “a look and see” to determine what’s coming out of interest that you may not know of. Then, as you gain confidence in certain biomarker profiles as part of a project, you may start to reduce your panel to be able to build more robustly that dataset around particular cell types or sub-cell types. So yes, from an image analysis perspective, these are doable.
Something else to think about with 100-plex studies is to make sure you have confidence in your section that you’re generating. Is it representative of the tissue and is it reproducible, and so forth. It’s certainly a dynamic and interesting area when we discuss the level of plex. As we move towards the clinic, I think getting more focus on that and triaging down to something that can be more reproducible is key.
If you have any questions, or would like more information on some of the topics discussed during this Q&A session, please look through our scientific content available in our resource center, https://ultivue.com/resource-center
hafadmin Categories: Uncategorized Tags: immunofluorescence, spatial biology, tumor microenvironmentYou are currently viewing a placeholder content from Facebook. To access the actual content, click the button below. Please note that doing so will share data with third-party providers.
More InformationYou need to load content from reCAPTCHA to submit the form. Please note that doing so will share data with third-party providers.
More InformationYou are currently viewing a placeholder content from Hubspot Embedded Content. To access the actual content, click the button below. Please note that doing so will share data with third-party providers.
More InformationYou are currently viewing a placeholder content from HubSpot. To access the actual content, click the button below. Please note that doing so will share data with third-party providers.
More InformationYou are currently viewing a placeholder content from Hubspot Meetings. To access the actual content, click the button below. Please note that doing so will share data with third-party providers.
More InformationYou are currently viewing a placeholder content from Instagram. To access the actual content, click the button below. Please note that doing so will share data with third-party providers.
More InformationYou are currently viewing a placeholder content from X. To access the actual content, click the button below. Please note that doing so will share data with third-party providers.
More Information

 tumor microenvironment
6535
Living in a Spatial World Q&A, Part 2
tumor microenvironment
6535
Living in a Spatial World Q&A, Part 2